

Murphy – Cherokee County improved its development tier ranking from Tier 1 – the most economically distressed in the three-tier system – to Tier 2 – the middle ranking.
Cherokee County’s distress rank improved from 32nd in the state in 2024 (with first being the most distressed and 100 being the least) to 46th in 2025.
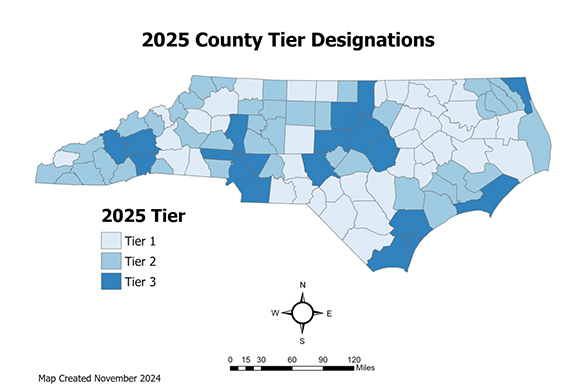
The N.C. Department of Commerce annually ranks the state’s 100 counties based on economic well-being and assigns each a tier designation. The tiers are:
- Tier 1: The most distressed 40 counties, including Graham County.
- Tier 2: The next most distressed 40 counties, including Cherokee, Clay, Macon, Swain and Transylvania counties.
- Tier 3: The least distressed 20 counties, including Buncombe, Haywood and Henderson counties.
The tier designations are based on four factors: average unemployment rate, median household income, percentage growth in population and adjusted property tax base per capita.
Cherokee County’s improvement in tier rankings means it will be less likely to be approved for grants aimed at the state’s most economically distressed counties.
The tier designations are used to determine eligibility and guidelines for grant programs. For example, the Job Development Investment Grant program uses the tier designations to channel funds into infrastructure improvements in more economically distressed areas.
For 2025, Cherokee County’s economic distress rank improved to 46th (from 32nd in 2024). The county population growth rank improved 31 positions, its adjusted property tax base per capita rank improved by 10 positions and its median household income rank improved nine positions.
Cherokee County still ranked poorly for adjusted property tax base per capita (71st) and population growth (69th). The strength of its median household income (26th) and unemployment rank (31st) were primary factors in lifting the county from Tier 1 to Tier 2.
The tier system
North Carolina has used a three-level system for designating County Development Tiers since 2007. The designations are required by state law and determine a variety of state funding opportunities to assist in economic development.
“It’s worth noting that, while the impacts of Hurricane Helene continue to affect counties across western North Carolina, those impacts are not well captured in this year’s edition of the County Development Tiers,” according to the report’s executive summary.
“… The county unemployment rates are the only factor that account for Helene-related impacts to any degree for this years’ tiers. These unemployment rates are calculated as average annual rates, which this year include data from November 2023 through October 2024.”
Haywood County improved its rating from Tier 2 in 2024 to Tier 3 for 2025. Haywood and Cherokee are the only two counties in the far-western part of the state with rating changes from 2024 to 2025.
How tier rankings are calculated
The Development Tier Designation statute (§143B-437.08) provides specific guidelines for calculating annual tier rankings. This process assigns each county to a designation of Tier 1 (most distressed), Tier 2 or Tier 3 (least distressed).
Assuming no ties in rankings, the statute requires 40 Tier 1, 40 Tier 2 and 20 Tier 3 counties each year. In the event of a tie for the final position as a Tier 1 or Tier 2 county, both counties will be placed in the lower tier.
Tier rankings use four factors:
- Average unemployment rate for the most recent 12 months for which data are available (November 2023 through October 2024).
- Median household income for the most recent 12 months for which data are available (2022, U.S. Census, Small Area Income & Poverty Estimates).
- Percentage growth in population for the most recent 36 months for which data are available (July 2020 through July 2023).
- Adjusted property tax base per capita for the most recent taxable year (2024-25 fiscal year).
Each county is ranked from 1 to 100 on each variable, making the highest possible county rank sum 400 and the lowest 4. After calculating the county rank sum, counties are then ranked.
County tier changes in 2025
Eighteen counties will change tiers in 2025. Counties moving to a less-distressed tier include Cherokee, Chowan, Duplin, Gates, Granville, Haywood, Jones, Onslow and Pasquotank.
Counties moving to a more-distressed tier include Alexander, Caldwell, Camden, Cleveland, Davie, McDowell, Montgomery, Randolph and Surry. Brief explanations for each county’s tier change are below.
Changes among other counties in the west include:
- Alexander County, shifting from Tier 2 to Tier 1. The county’s economic distress rank weakened to #39 (from #46 in 2024). Despite the county median household income rank improving 27 positions, its unemployment rate rank declined by 23 positions and its adjusted property tax base per capita rank declined 18 positions.
- Haywood County, shifting from Tier 2 to Tier 3. The county’s economic distress rank improved to 83rd (from 78th in 2024). Despite the county unemployment rate rank declining 13 positions, its median household income rank improved by 21 positions.
- McDowell County, shifting from Tier 2 to Tier 1. The county’s economic distress rank weakened to 31st (from 47rd in 2024). The county adjusted property tax base per capita rank declined 16 positions and its unemployment rate rank declined by nine positions.
Best and worst
- Adjusted property tax base per capita: Dare County ranked 100th with value at $596,320. Edgecombe County ranked first with value at $78,238. Cherokee County ranked 71st with value at $173,160. The state average is $155,940.
- Population growth: Brunswick County ranked 100th with 15.63% growth. Hertford County ranked first with a 5.8% decline. Cherokee County ranked 69th with 3.24% growth. The state average was 3.59% growth.
- Median household income (2022): Wake County ranked 100th at $97,099. Robeson County ranked first at $39,931. Cherokee County ranked 26th at $51,607. Statewide average was $67,516.
- Unemployment rate (12-month average, November 2023 through October 2024): Green County ranked 100th at 2.96%. Scotland County ranked first at 6.4%.
Cherokee County ranked 31st at 4.05%. The statewide average was 3.65%.